Bitcoin drops below 200-week moving average for first time since 2022
In brief
- Bitcoin closed below the 200-week MA in late June 2026, first time since June 2022
- 200-week average aligned with bear-market lows in 2015, 2019, and 2022 across cycles
- Extended periods below this level historically coincided with capitulation and selling pressure
- Charts project the 200-week MA climbing toward low-to-mid $60,000s through 2026
Historical precedent
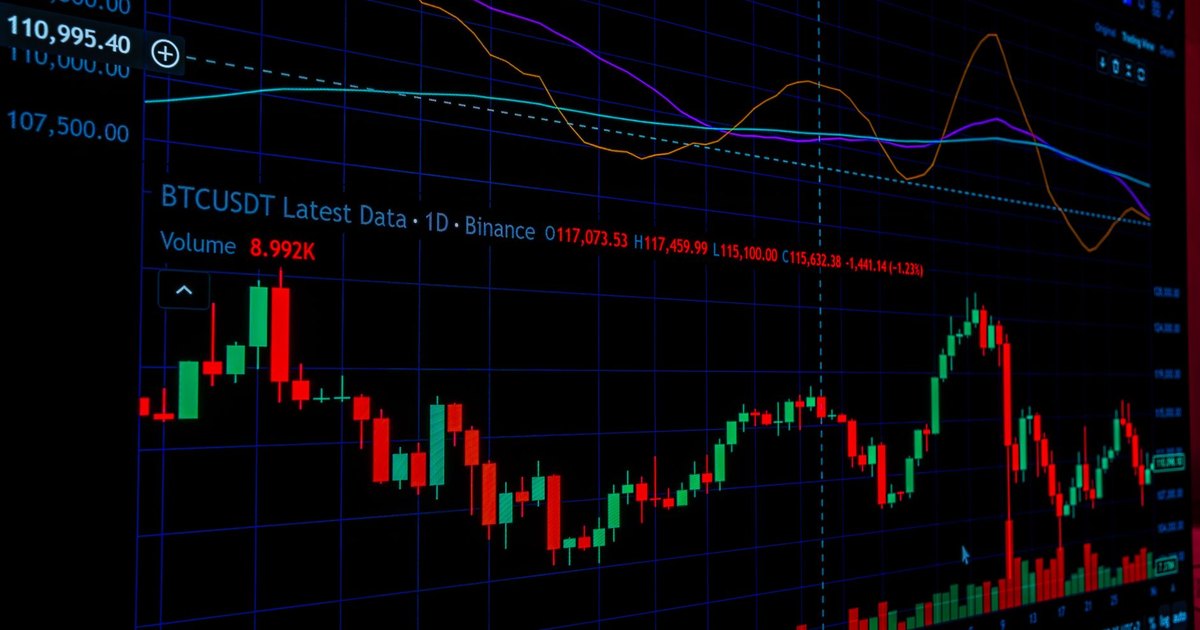
The last time Bitcoin closed a weekly candle below the 200-week moving average was June 2022. What followed was a slide below $22,000 and a stretch of more than a year trading under the average before finally reclaiming it in October 2023. The 200-week moving average has aligned with bear-market lows across multiple cycles, including 2015, 2019, and 2022.
Extended periods below the 200-week MA have historically coincided with capitulation phases where selling pressure intensifies. This pattern suggests the current breach carries weight—it's not just a technical blip, but a signal that warrants close monitoring.
What triggered the breakdown
A strong May payrolls report reshuffled expectations around Federal Reserve rate cuts, pushing yields higher and risk assets lower. In early June 2026, spot Bitcoin traded below $61,000 for the first time since the previous cycle low, a move driven largely by this macro headwind.
What comes next
Charts from platforms like Bitbo, Newhedge, and CoinGlass project the average climbing toward the low-to-mid $60,000s throughout 2026. If Bitcoin manages to close back above the 200-week MA in the coming weeks, the current breach could be reclassified as a wick—a temporary dip that tested support and held.
The stakes are high. A sustained close above this level would restore confidence that the current cycle remains intact. A failure to reclaim it could extend the capitulation phase and trigger deeper selling.