Bitcoin, Solana, XRP Rally From Oversold Levels as Technicals Reset
In brief
- Bitcoin bounced from ~$60K capitulation after high-volume breakdown from $75K–$78K range
- RSI recovered from oversold; price remains below major moving averages in downtrend
- Solana and XRP show similar technicals: short-term recovery attempts within bearish trends
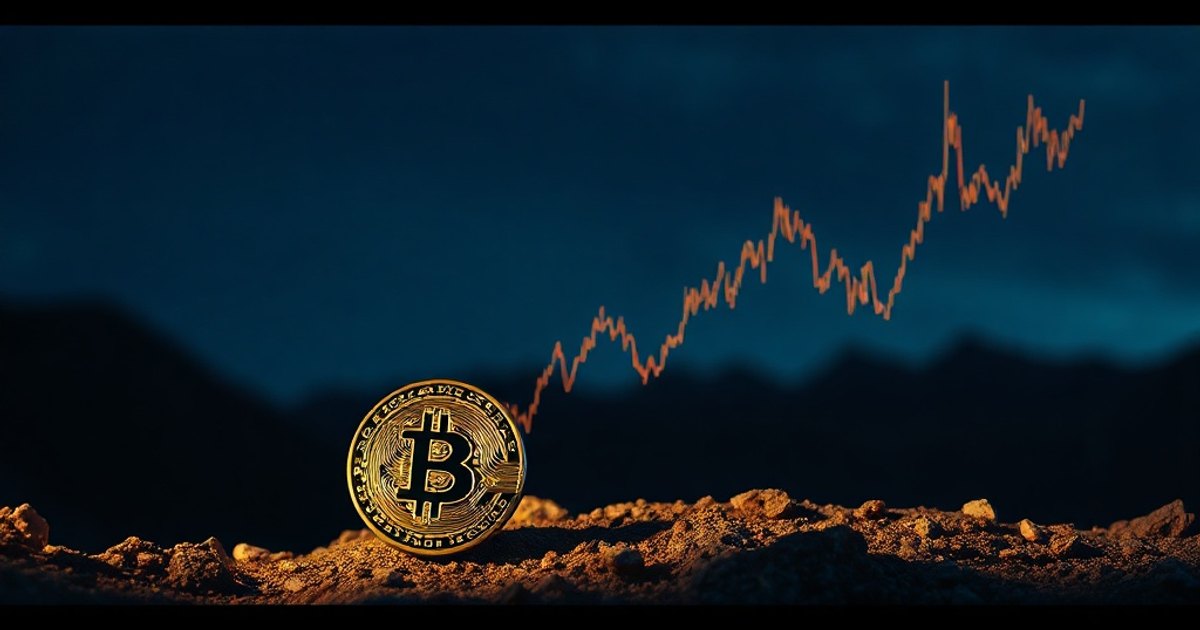
Bitcoin's Countertrend Bounce
Bitcoin experienced a high-volume capitulation move resulting from an abrupt breakdown from the $75,000–$78,000 range and rapid decline toward the $60,000 area. Despite the recent recovery from June lows, BTC remains in a medium-term downtrend. The price is still below the downward-sloping 20-day, 50-day, 100-day, and 200-day moving averages, indicating a strongly bearish market structure.
The most significant resistance zone is located between the 20-day EMA at $67,000 and the 50-day SMA at $74,000. The recent low of approximately $60,000 continues to be the primary support on the downside. Bitcoin appears to be in a countertrend bounce within a larger bearish trend. For bulls, the next test will be whether the bounce can sustain above the $67,000 level.
Solana Mirrors Bitcoin's Structure
Due to its strong correlation with the broader cryptocurrency market, SOL's structure is strikingly similar to that of Bitcoin. Solana experienced a major breakdown that drove the price from the upper-$80s into the low-$60s after months of lower highs and lower lows. The price has recently increased and is now closer to $74, though the recovery is still technically risky.
The price is still below all major moving averages, and the 20-day EMA, which is located between $74 and $75, is serving as immediate resistance. A dense resistance zone is created by the 50-day SMA at $81 and the 100-day SMA at $85. The RSI is approaching the midpoint and has recovered significantly from oversold conditions. A move toward the low-$80s is conceivable if SOL can recover and maintain its position above the $75 mark.
XRP's Breakdown and Recovery Attempt
After breaking below a multi-month declining triangle, XRP is trying to rebound. The chart displayed a lengthy period of compression between a declining resistance trendline and about $1.25 support before sellers forced a breakdown. The price has recently recovered to the previous support area around $1.22–$1.25, which is encouraging.
XRP continues to trade below its 20-day, 50-day, 100-day, and 200-day moving averages, all of which are still declining. The 20-day EMA is currently the first significant test for bulls, while the 50-day SMA around $1.32–$1.38 represents stronger resistance. The volatility spike that triggered these capitulations has reset oversold conditions, creating room for near-term bounces. Whether these recoveries can sustain depends on reclaiming key moving-average levels.