Coinbase data shows XRP options pricing a move 1.94x its historical median
In brief
- XRP's options-implied 7-day move stood at 1.94x its own median, Coinbase Markets data shows, per U.Today.
- Bitcoin read 1.69x, Ethereum 1.56x and Solana 1.46x on the same metric.
- The ratio measures each asset against its own history, not dollar or percentage moves.
- XRP traded at $0.98, down 1.93% over 24 hours, when U.Today reported the data.
What the Coinbase ratio measures
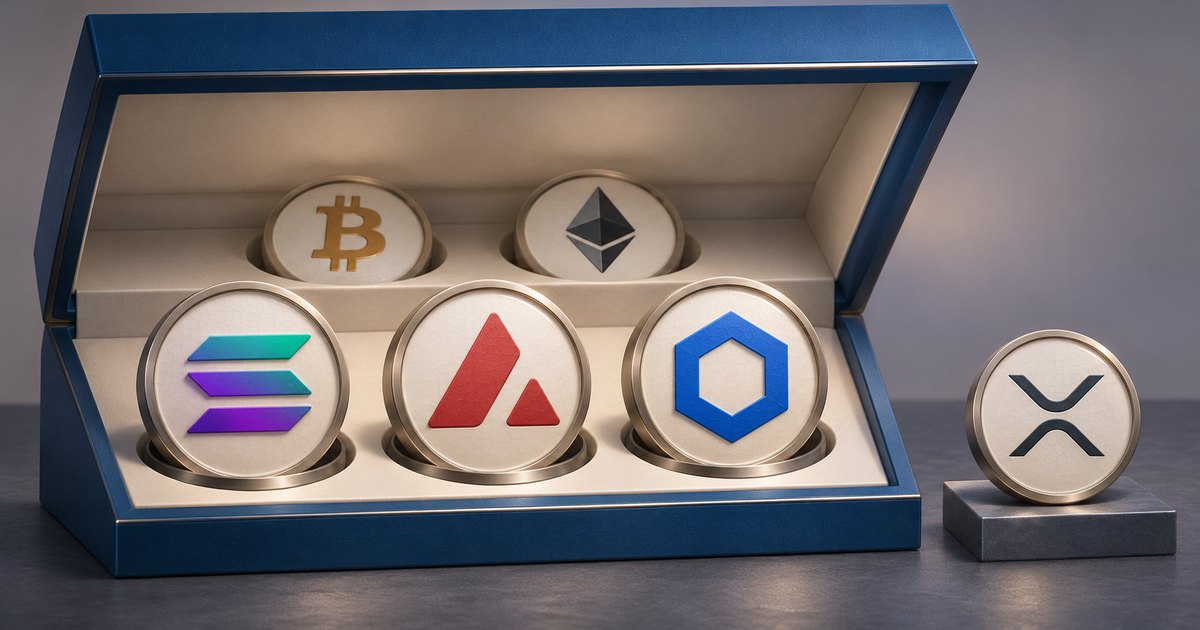
Coinbase Markets divided each asset's options-implied 7-day move by its own median 7-day move and posted the results for XRP, Bitcoin, Ethereum and Solana on X. Bitcoin came in at 1.69 times, Ethereum at 1.56 times and Solana at 1.46 times (XRP led the group at 1.94 times).
The post put it bluntly.
"$XRP is priced furthest above its own history, $SOL the least. Which one is asking for more than its own history delivered?"
It's a relative measure. The ratio shows how much movement options markets were pricing in compared with each asset's own past behavior, and it doesn't directly compare expected moves in dollars or percentages. So XRP's 1.94 reading tells you its implied move sits further above XRP's own norm than Bitcoin's does above Bitcoin's. U.Today said this suggested options traders were pricing in a bigger move than XRP has usually made over a similar period.
XRP price backdrop
At the time of U.Today's report, XRP was down 1.93% over 24 hours at $0.98 as traders kept taking profits across the market. The token briefly reached $1 on November 18, 2026, then fell as traders took profits. XRP was down 21.57% so far in November, according to the outlet.
November history, per U.Today
U.Today's figures show XRP's average November gain is pulled upward by outlier rallies of +550% in 2013 and +282% in 2024. Strip those out and the picture changes: the median November return was about -10%, meaning XRP closed the month lower in most past cycles. The token fell roughly 23.42% in November 2019 and lost 12.18% in November 2025 (opening that month around $2.51 and closing around $2.20).
There's a counterexample, too. After falling 9.1% in November 2015, XRP rose 46.8% in December 2015, per U.Today.
U.Today's own analysis said a further XRP decline would likely find support at $0.89. That level comes from the outlet's analysis, not from the Coinbase options data, which doesn't point to a direction for the move it's pricing.
Frequently asked questions
What does Coinbase's 1.94x options ratio for XRP measure?
It divides XRP's options-implied seven-day move by XRP's own historical median seven-day move. The ratio shows how much movement options markets were pricing in compared with the asset's past behavior. It doesn't directly compare expected moves in dollars or percentages.
How did Bitcoin, Ethereum and Solana compare with XRP on the Coinbase metric?
In the Coinbase Markets figures reported by U.Today, Bitcoin's ratio was 1.69 times, Ethereum's was 1.56 times and Solana's was 1.46 times. XRP had the highest relative reading of the four at 1.94 times.