Bitcoin clears 50-week moving average; $83K–$86K zone is the real test
In brief
- Bitcoin intraday high above $82,000 on Sept. 3 crossed the 50-week moving average, marking historical bear-market reversals.
- Galaxy Research identified this level as the definitive end of four of five comparable completed bear markets.
- Weekly close above $81,800–$86,000 required to confirm; intraday wicks do not trigger the signal.
- Three analysts converge on $83,000–$86,000 as critical resistance where long-term-holder supply is dense.
- Glassnode traced mid-August rally to short squeeze and $2.8B ETF inflows; funding rates remain contained.
The 50-Week Signal and Its Trap
Galaxy's framework traces the current bear market's start to a $124,800 peak in October 2025 and its low near $58,500 at the end of June—a drawdown of roughly 53%. In four of the five completed bear markets where Bitcoin fell below that ceiling, the first successful weekly reclaim marked the bottom. The exception came in 2021 and 2022, when Bitcoin briefly reclaimed the 50-week moving average twice before falling to a fresh low—a pattern that keeps traders wary.
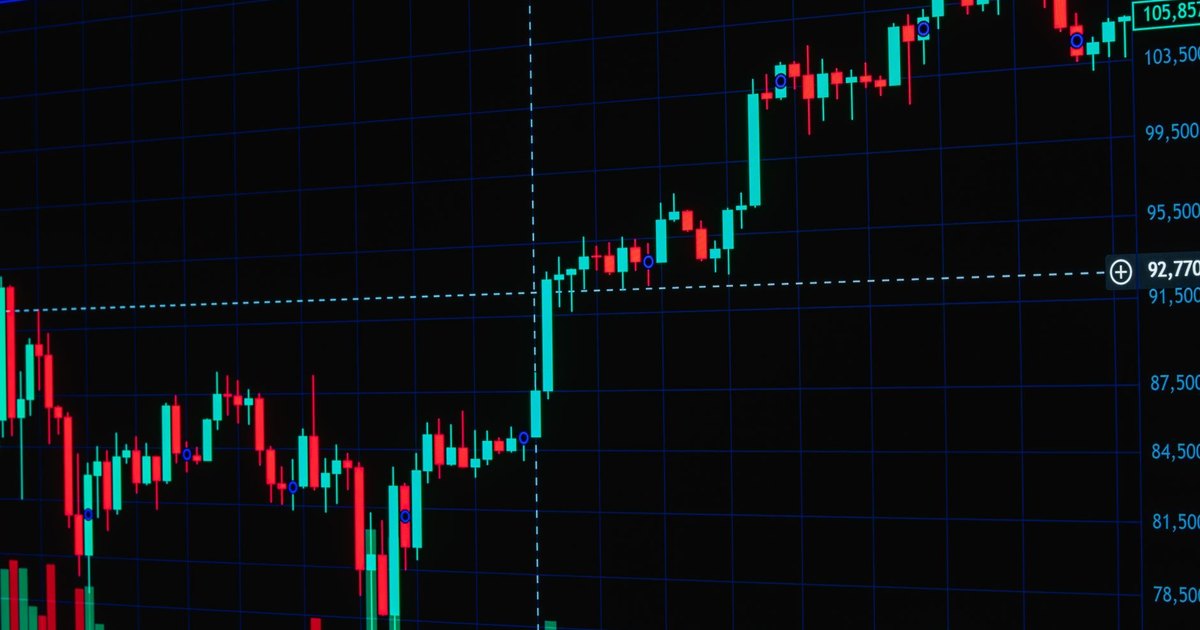
The 50-week line currently sits around $81,800. Bitcoin's intraday push above $82,000 happened well before the week's close, leaving the confirmation still pending. That distinction matters. Galaxy's signal has never been satisfied by an intraday wick alone; a genuine weekly close above the level is required to mark a regime shift.
Convergence at $83k–$86k
Three independent research teams have flagged the same resistance band. Galaxy's moving average, Glassnode's supply data, and 21Shares' regime band all independently cluster in the same broad $83,000 to $86,000 zone. Glassnode identified this band as a dense concentration of long-term-holder supply—the level where holders who bought earlier tend to take profits or hold firm.
Glassnode's data shows real spot participation and ETF inflows behind the rally's earlier stages. The mid-August leg was traced to a short squeeze that pushed Bitcoin from roughly $63,500 toward $80,000, accompanied by about $2.8 billion of ETF inflows, falling futures open interest, and contained funding rates. ETF intake later peaked near $290 million a day, though secondary-market turnover on those same ETFs stayed closer to $3 billion daily.
The Bull Case and the Headwind
Bitwise's September 1 research argues that Bitcoin's reclaimed price levels, combined with its Long-Term Holder Supply and Risk-On Transition models, point to a new bull market cycle already underway. At comparable prices, 68% of Bitcoin's supply now sits in profit, up from 65% during a similar test in May—a sign that more holders are in the green and may be less inclined to panic-sell.
CryptoQuant analyst Darkfost reported on September 2 that Bitcoin's apparent demand briefly turned negative again after its short recovery earlier in August faded. Wallets holding more than 100 BTC added roughly 60,000 BTC during August even as smaller holders sold—a divergence that suggests institutional accumulation underneath retail weakness.
Macro headwinds persist. Fed Governor Christopher Waller has pointed to fiscal strain keeping Treasury yields elevated in the high-4% range. The Treasury's August 19 move to at least double its long-end liquidity-support buybacks helped fuel the initial leg of the rally, but QCP has cautioned that operations function as liquidity support, well short of full monetary easing.
Bitcoin needs to clear and hold the $83,000 to $86,000 band to genuinely absorb the long-term-holder supply and confirm a turn. Until then, the intraday cross of $82,000 remains a signal, not a confirmation.