Bitcoin reclaims 50-day moving average, signals potential bullish reversal
In brief
- Bitcoin reclaimed the 50-day moving average near $64,300 and short-term holder cost basis around $67,124-$67,152
- Recent buyers turning profitable reduces panic selling and creates conditions for further upside
- Sustained periods above both short-term and long-term holder cost bases align with bull market phases
Technical Levels in Focus
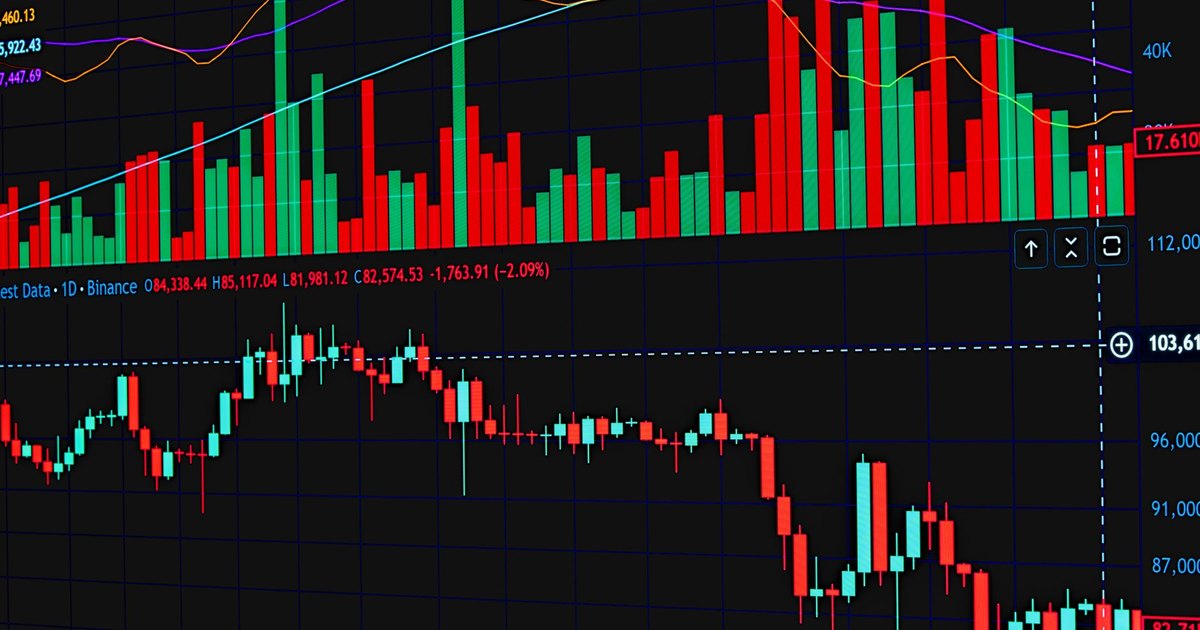
The 50-day moving average and exponential moving average tracked in the $64,000 to $65,000 range, with BTC reclaiming approximately $64,300 during mid-August analysis. The short-term holder realized price sat around $67,124 to $67,152 at the same time.
The short-term holder realized price reflects the average cost basis of coins held for fewer than 155 days. When Bitcoin trades below this level, recent buyers face losses, creating a feedback loop of selling that pushes price lower. Reclaiming that threshold reverses the dynamic.
Historical Precedent
Bitcoin staged a rally in May when it surged above a then-current short-term holder cost basis of roughly $79,000. That move prompted analysts to float price targets as high as $92,000. The pattern matters because historical cycle analysis has repeatedly shown that sustained periods where Bitcoin trades above both the short-term holder and long-term holder cost bases tend to align with bull market phases.
BTC reclaiming the average purchase price of recent buyers has historically preceded sustained rallies. If the current setup holds, it could signal the start of a longer-term uptrend. The key is whether BTC can stay above both levels — a test traders will watch closely in the weeks ahead.